The ZigZag on Parabolic Indicator MT4 is a combination of the default parabolic indicator and the zigzag indicator.
In fact, you could potentially make use of both these indicators to get the same results as the custom indicator called the ZigZag on Parabolic Indicator.
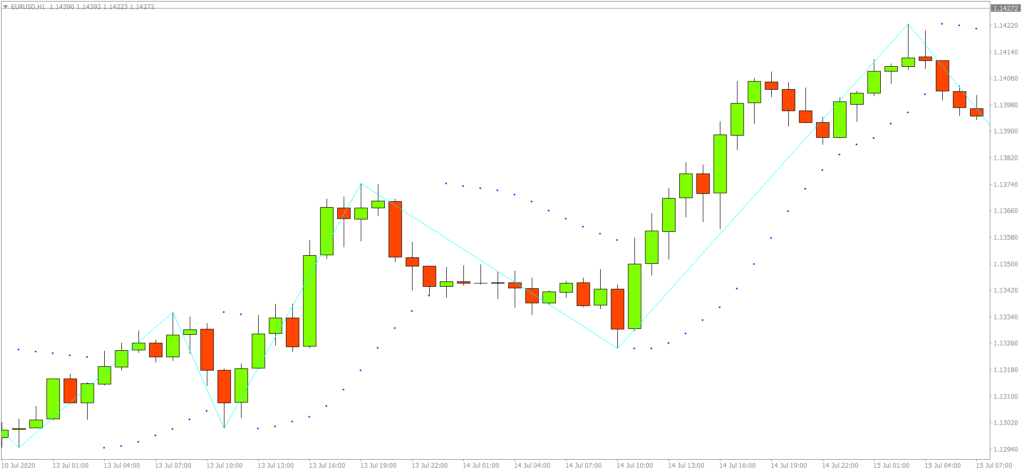
As the name suggests, this indicator plots the zigzag lines and the PSAR dots on the price chart.
When to go long using the ZigZag on Parabolic Indicator?
Wait for a high to form and then wait for PSAR’s to be plotted above price.
Following this, you will first see the zigzag plotting a low.
Go long when the PSAR makes the first plot below the low of the price.
When to exit your long positions?
Exit the long position either based on a fixed risk to reward set up or wait until you get an opposite signal.
When to go short using the ZigZag on Parabolic Indicator?
Look for Zigzag to plot a low and the PSAR to plot below the price.
When the PSAR is broken and you see the Zig Zag plotting a high, go short on the next candlestick opens.
When to exit your short positions?
Exit the long position either based on a fixed risk to reward set up or wait until you get an opposite signal.
Where to set the stop loss?
Set the stop loss to the low or the high of the candlestick that breached the PSAR dot first.
Conclusion
The ZigZag on Parabolic Indicator is a simple to use technical indicator.
It allows you to scalp the forex markets but only in the short term.
It works best only when the market is in a strong trend.
During choppy markets, you will be prone to false signals.